# Figure 4.12, page 187.
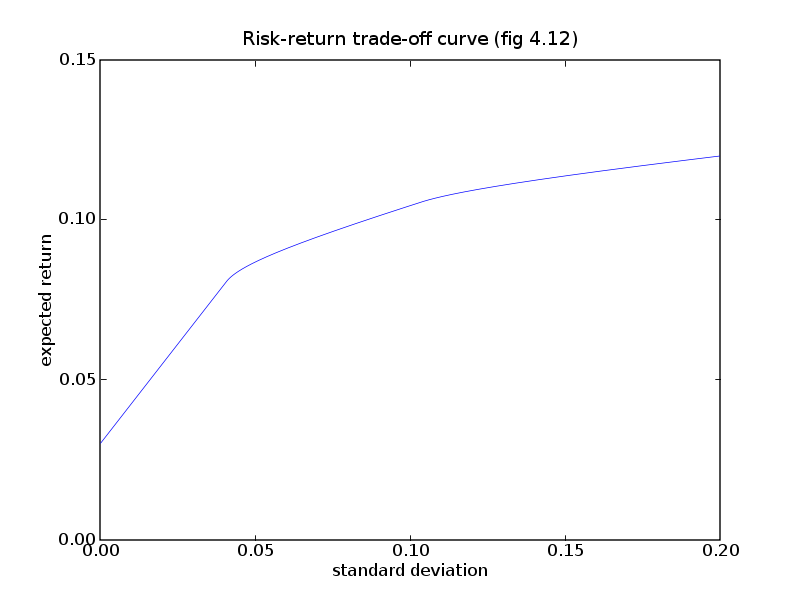
# Risk-return trade-off.
from math import sqrt
from cvxopt import matrix
from cvxopt.blas import dot
from cvxopt.solvers import qp, options
n = 4
S = matrix( [[ 4e-2, 6e-3, -4e-3, 0.0 ],
[ 6e-3, 1e-2, 0.0, 0.0 ],
[-4e-3, 0.0, 2.5e-3, 0.0 ],
[ 0.0, 0.0, 0.0, 0.0 ]] )
pbar = matrix([.12, .10, .07, .03])
G = matrix(0.0, (n,n))
G[::n+1] = -1.0
h = matrix(0.0, (n,1))
A = matrix(1.0, (1,n))
b = matrix(1.0)
N = 100
mus = [ 10**(5.0*t/N-1.0) for t in range(N) ]
options['show_progress'] = False
xs = [ qp(mu*S, -pbar, G, h, A, b)['x'] for mu in mus ]
returns = [ dot(pbar,x) for x in xs ]
risks = [ sqrt(dot(x, S*x)) for x in xs ]
try: import pylab
except ImportError: pass
else:
pylab.figure(1, facecolor='w')
pylab.plot(risks, returns)
pylab.xlabel('standard deviation')
pylab.ylabel('expected return')
pylab.axis([0, 0.2, 0, 0.15])
pylab.title('Risk-return trade-off curve (fig 4.12)')
pylab.yticks([0.00, 0.05, 0.10, 0.15])
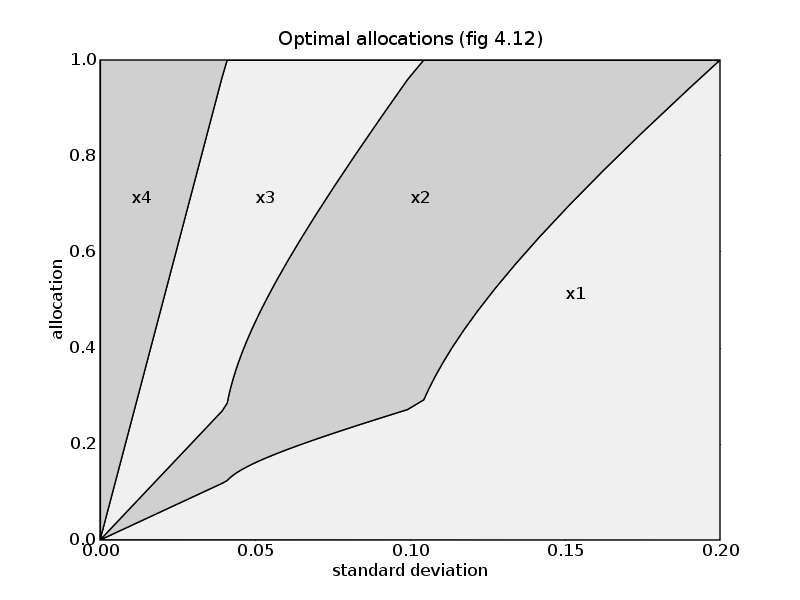
pylab.figure(2, facecolor='w')
c1 = [ x[0] for x in xs ]
c2 = [ x[0] + x[1] for x in xs ]
c3 = [ x[0] + x[1] + x[2] for x in xs ]
c4 = [ x[0] + x[1] + x[2] + x[3] for x in xs ]
pylab.fill(risks + [.20], c1 + [0.0], facecolor = '#F0F0F0')
pylab.fill(risks[-1::-1] + risks, c2[-1::-1] + c1,
facecolor = '#D0D0D0')
pylab.fill(risks[-1::-1] + risks, c3[-1::-1] + c2,
facecolor = '#F0F0F0')
pylab.fill(risks[-1::-1] + risks, c4[-1::-1] + c3,
facecolor = '#D0D0D0')
pylab.axis([0.0, 0.2, 0.0, 1.0])
pylab.xlabel('standard deviation')
pylab.ylabel('allocation')
pylab.text(.15,.5,'x1')
pylab.text(.10,.7,'x2')
pylab.text(.05,.7,'x3')
pylab.text(.01,.7,'x4')
pylab.title('Optimal allocations (fig 4.12)')
pylab.show()